Last year we had some good results with the Aurora noisy digits task. For 2000, the Aurora co-ordinators have come up with a slightly different task that perhaps more closely resembles real conditions. It is still based on artificial mixtures of digit strings (from TIDigits) and various background noises at various SNRs, but this year there are three test conditions: matched noise (test data is mixed with the exact same background noises that were mixed into the training data), mismatched noise (different background noises in the test set) and channel variation (where the test set also has a fixed spectral coloration compared to the training set. Another change was that the total energy was normalized in last year's data, but this year the sample energy roves over a far wider range.
For this year's task, ICSI is again collaboration with Hynek Hermansky's group at OGI. This page contains a diary of the experiments and activities carried out at ICSI, mainly in support of the work being done at OGI.
To help with a training to be performed up at OGI, I made an initial forced alignment of the new Aurora2000 data, to obtain training target labels. I used a neural net trained on the 1999 data, but to avoid problems with the energy variation the net had to employ per-utterance normalized features (no good for real-time operation, but fine for making an alignment). I used a plp12ddN net, which was the best-performing single net using utterance normalization from last year.
I also made the alignment against the clean versions of every utterance, then assumed that the alignments in the noise-corrupted examples ought to be the same. This was possible because Aurora2000 includes a trained-on-clean-only option, so the entire training set is provided in clean form. I checked that utterances with the same name did indeed exhibit alignment of the target speech between clean and noisy versions, which appeared to be the case.
I visited Hynek and his students up in Oregon. They had tried using my labels for a training, then done the 'Tandem' arrangement of feeding the net outputs into HTK, but it had shown no improvement over training HTK on the features directly! (LDA-derived bandpassed filters in this case).
This was a bit of a shock, so I set about doing trainings of my own based on these labels to see if they were any good. Our best guess was that using alignments from clean data wasn't such a good idea, or perhaps just that the labels were somehow screwed up. I trained four nets: one on my original labels, which I then used to make new forced alignments of both the clean and the noise-corrupted training sets. I then trained new nets based on both these alignments. For interest and completeness, I also trained a net on the clean training data, using the labels derived from that data. Summary results are as below:
        a2-testa - plp12ddN  (my original, clean-based labels):
        WER%    N1      N2      N3      N4      avg
        CLEAN     2.6     3.0     2.6     3.1   2.8
        SNR20     2.3     7.0     2.3     1.9   3.4
        SNR15     2.9    11.2     2.5     1.8   4.6
        SNR10     6.0    20.6     3.3     2.5   8.1
        SNR5     12.1    38.0     6.4     3.9   15.1
        SNR0     28.7    62.4    17.2     7.9   29.1
        SNR-5    55.7    82.6    47.2    20.1   51.4
                        Mean ratio to HTK base = 130.1%
                             Avg. WER 20-0 SNR = 12.04%
        a2-testa - a2-aa2-clean-i1 (labels from realigned clean data) :
        WER%    N1      N2      N3      N4      avg
        CLEAN     2.8     3.1     2.9     3.1   3
        SNR20     2.2     2.2     2.0     2.7   2.3
        SNR15     2.9     2.8     2.6     3.7   3
        SNR10     3.7     4.7     3.7     5.5   4.4
        SNR5      8.1    11.5     7.3    10.9   9.4
        SNR0     26.5    36.4    18.2    25.5   26.6
        SNR-5    62.7    74.5    50.3    52.7   60
                        Mean ratio to HTK base = 100%
                             Avg. WER 20-0 SNR = 9.15%
        a2-testa - a2a-plp12ddN-multi-i1 (trained to labels from noisy data):
        WER%    N1      N2      N3      N4      avg
        CLEAN     2.7     2.9     3.0     2.8   2.8
        SNR20     2.1     2.3     1.8     2.6   2.2
        SNR15     2.6     3.0     2.5     3.2   2.8
        SNR10     3.7     4.4     3.5     5.1   4.2
        SNR5      8.1    11.8     7.0    10.9   9.4
        SNR0     25.7    36.9    19.2    24.3   26.5
        SNR-5    63.6    77.3    52.8    52.7   61.6
                        Mean ratio to HTK base = 97.1%
                             Avg. WER 20-0 SNR = 9.04%
        a2-testa - a2clean-aclean-i1  (trained on *clean data*):
        WER%    N1      N2      N3      N4      avg
        CLEAN     1.4     1.8     1.8     1.7   1.7
        SNR20     5.4     3.4     2.6     7.4   4.7
        SNR15     9.5     5.7     4.8    13.5   8.4
        SNR10    17.3    11.9     9.0    25.0   15.8
        SNR5     32.0    27.5    17.1    39.5   29
        SNR0     52.5    57.2    35.7    58.1   50.9
        SNR-5    79.9    87.4    65.7    77.1   77.5
                        Mean ratio to HTK base = 187.7%
                             Avg. WER 20-0 SNR = 21.75%
It certainly appears that training based on labels derived from the actual noisy multicondition training data is the most successful approach. Not sure why, although certainly I would expect big differences between the alignments for the noisier utterances.
Since realignment seemed to be required, I adapted my scripts from last year to support embedded training using the 2000 data. The result of an embedded training, still using the plp12ddN features, showed no real improvements through iterations. The best result was the first, i.e.
        a2-testa - plp12ddN-ta2multi-i0 :
        WER%    N1      N2      N3      N4      avg
        CLEAN     2.8     3.1     2.4     2.6   2.7
        SNR20     2.1     2.2     1.6     2.5   2.1
        SNR15     2.9     2.8     2.3     3.1   2.8
        SNR10     3.7     4.6     3.5     5.1   4.2
        SNR5      8.2    11.3     6.8    10.9   9.3
        SNR0     25.9    36.5    18.1    24.3   26.2
        SNR-5    62.7    76.0    51.6    52.9   60.8
                        Mean ratio to HTK base = 94.8%
                             Avg. WER 20-0 SNR = 8.92%
I did the same thing using msg3N feature too. Here again, the best result was on the boot iteration, using the noisy-data-derived labels from the initial realignment:
        a2-testa - msg3N-ta2multi-i0 :
        WER%    Hall    Babble  Train   Car     avg
        CLEAN     2.1     3.0     2.2     2.7   2.5
        SNR20     1.9     2.3     2.0     2.3   2.1
        SNR15     2.5     3.1     2.3     2.9   2.7
        SNR10     4.7     5.8     4.1     4.5   4.8
        SNR5      9.4    13.9     7.1    10.7   10.3
        SNR0     26.7    40.1    20.0    26.0   28.2
        SNR-5    62.0    79.2    54.1    56.3   62.9
                        Mean ratio to HTK base = 96.5%
                             Avg. WER 20-0 SNR = 9.62%
Since these nets were performingly notably worse (relative to HTK) than comparable situations with last year's data, I decided to get closer to the process used in last year's training target generation, and perform a realignment based on the posterior combination (multiplying the probabilities for a given phone class from each model) of plp- and msg-based models. Training both plp and msg nets on these new labels gave little or no improvement; embedded realignment gave no further WER reduction:
        a2-testa - plp12ddN-ta2multi-i0 :
        WER%    Hall    Babble  Train   Car     avg
        CLEAN     2.7     3.1     3.2     2.7   2.9
        SNR20     1.9     2.1     1.8     2.7   2.1
        SNR15     2.8     2.7     2.0     2.9   2.6
        SNR10     3.8     4.0     3.4     5.2   4.1
        SNR5      8.2    10.8     7.0    11.5   9.4
        SNR0     25.5    35.8    19.4    24.7   26.4
        SNR-5    63.0    76.0    53.0    52.0   61
                        Mean ratio to HTK base = 95.6%
                             Avg. WER 20-0 SNR = 8.91%
        a2-testa - msg3N-ta2multi-i0 :
        WER%    Hall    Babble  Train   Car     avg
        CLEAN     2.1     3.0     2.6     2.9   2.6
        SNR20     2.0     2.7     1.9     2.7   2.3
        SNR15     3.0     3.3     2.2     3.2   2.9
        SNR10     4.8     6.0     3.8     4.6   4.8
        SNR5      9.7    15.0     7.6    10.6   10.7
        SNR0     27.8    39.9    20.5    26.9   28.8
        SNR-5    61.3    81.4    54.3    56.0   63.2
                        Mean ratio to HTK base = 100.7%
                             Avg. WER 20-0 SNR = 9.91%
Peversely, the msg is doing worse than it did with labels that had not been based on msg at all!
I then did another posterior-combination realignment, and trained yet another pair of MSG and PLP nets, with similar results:
        a2-testa - plp12ddN-ta2multi-i0 :
        WER%    Hall    Babble  Train   Car     avg
        CLEAN     2.8     2.9     2.7     2.7   2.8
        SNR20     1.7     2.0     1.7     2.4   2
        SNR15     2.5     2.7     2.5     3.1   2.7
        SNR10     3.7     4.3     3.3     5.2   4.1
        SNR5      8.0    10.5     7.1    10.7   9.1
        SNR0     25.1    35.2    18.8    24.5   25.9
        SNR-5    62.4    75.0    53.5    52.1   60.8
                        Mean ratio to HTK base = 93.4%
                             Avg. WER 20-0 SNR = 8.75%
        a2-testa - msg3N-ta2multi-i0 :
        WER%    N1      N2      N3      N4      avg
        CLEAN     2.1     3.0     2.6     2.9   2.6
        SNR20     2.0     2.7     1.9     2.7   2.3
        SNR15     3.0     3.3     2.2     3.2   2.9
        SNR10     4.8     6.0     3.8     4.6   4.8
        SNR5      9.7    15.0     7.6    10.6   10.7
        SNR0     27.8    39.9    20.5    26.9   28.8
        SNR-5    61.3    81.4    54.3    56.0   63.2
                        Mean ratio to HTK base = 100.7%
                             Avg. WER 20-0 SNR = 9.91%
Since these results are barely improved over the previous generation, I decided that this training procedure must have stabilized, and I released the first generation of plp+msg-based labels as the new training set for the OGI folk.
Although the error rates from the fully connectionist system are not as good as last year, it's still worth feeding the pre-nonlinearity net outputs as features into HTK to see how well it can model them. Also, it's interesting to try this for the mismatched test cases. Here's the performance on the single best plp12ddN-based net from above:
        a2-testa: UNKNOWN (a2-lin-plp_ftr/multi_testa.result) :
        WER%    N1      N2      N3      N4      avg
        CLEAN   1.4     1.3     1.4     1.4     1.4
        SNR20   1.0     1.2     1.2     1.3     1.2
        SNR15   1.6     1.8     1.8     2.1     1.8
        SNR10   3.2     2.8     3.1     3.4     3.1
        SNR5    6.5     7.5     6.3     9.1     7.3
        SNR0    19.1    28.8    17.2    21.8    21.7
        SNR-5   54.1    72.1    48.1    47.7    55.5
                        Mean ratio to HTK base = 64.1%
                             Avg. WER 20-0 SNR = 7.04%

        a2-testb: UNKNOWN (a2-lin-plp_ftr/multi_testb.result) :
        WER%    N1      N2      N3      N4      avg
        CLEAN   1.4     1.3     1.4     1.4     1.4
        SNR20   1.0     1.5     1.3     1.0     1.2
        SNR15   1.4     2.1     2.1     1.5     1.8
        SNR10   3.2     4.3     2.9     2.9     3.3
        SNR5    9.8     10.3    8.0     9.3     9.4
        SNR0    32.1    28.8    25.7    26.3    28.2
        SNR-5   72.9    60.9    61.4    57.5    63.2
                        Mean ratio to HTK base = 61.6%
                             Avg. WER 20-0 SNR = 8.78%

        a2-testc: UNKNOWN (a2-lin-plp_ftr/multi_testc.result) :
        WER%    N1      N2      avg
        CLEAN   1.3     1.2     1.3
        SNR20   1.1     2.0     1.6
        SNR15   1.7     2.2     2.0
        SNR10   3.2     4.0     3.6
        SNR5    7.0     10.2    8.6
        SNR0    20.1    28.3    24.2
        SNR-5   53.5    62.5    58.0
                        Mean ratio to HTK base = 56.9%
                             Avg. WER 20-0 SNR = 7.98%
Here are the results for the matched-noise test using the outputs of the best msg3N net:
        a2-testa: UNKNOWN (a2-lin-msg_ftr/multi_testa.result) :
        WER%    N1      N2      N3      N4      avg
        CLEAN   1.3     1.6     1.6     1.4     1.5
        SNR20   1.3     1.3     1.2     1.4     1.3
        SNR15   2.0     2.0     1.9     1.9     1.9
        SNR10   3.4     3.3     3.1     3.5     3.4
        SNR5    8.0     9.5     5.6     7.8     7.7
        SNR0    22.6    32.3    18.7    21.0    23.7
        SNR-5   55.3    72.8    53.8    50.2    58.0
                        Mean ratio to HTK base = 68.9%
                             Avg. WER 20-0 SNR = 7.59%
So, Tandem modeling still works great. And the mismatch conditions aren't hurting our technique, fortunately.
This approach, where the pre-nonlinearity outputs of neural nets are summed together, orthogonalized, then used as features to train the standard HTK system, was our big winner last year, and recreating it with this year's data works great too, across all the multitrain conditions. The only caveat is that since the feature sets (plp12ddN and msg3N) are per-utterance normalized, they are not compliant with the low-latency requirement of the evaluation. Per-utterance normalization is presumably important for robustness to level variation and channel characteristics, but I'm implementing simple online normalization to take its place.
        Test A: Matched noise: htk3-plp+msg (multi_testa.result) :
        WER%    N1      N2      N3      N4      avg
        CLEAN   0.7     0.8     0.8     0.8     0.8
        SNR20   0.8     0.8     0.8     1.0     0.8
        SNR15   1.2     1.2     1.4     1.4     1.3
        SNR10   2.3     2.4     2.6     2.2     2.4
        SNR5    5.2     7.0     5.0     6.9     6.0
        SNR0    17.9    26.2    15.9    18.5    19.6
        SNR-5   50.3    68.1    46.8    44.1    52.3
                        Mean ratio to HTK base = 49.0%
                             Avg. WER 20-0 SNR = 6.04%

        Test B: Mismatched noise: htk3-plp+msg (multi_testb.result) :
        WER%    N1      N2      N3      N4      avg
        CLEAN   0.7     0.8     0.8     0.8     0.8
        SNR20   0.8     0.8     1.1     0.8     0.9
        SNR15   1.2     1.5     1.5     1.3     1.4
        SNR10   3.0     3.0     2.6     2.0     2.6
        SNR5    8.8     8.1     7.0     7.1     7.8
        SNR0    30.1    22.9    23.2    22.6    24.7
        SNR-5   69.1    54.4    58.7    54.2    59.1
                        Mean ratio to HTK base = 47.8%
                             Avg. WER 20-0 SNR = 7.46%

        Test C: Channel distortion: htk3-plp+msg (multi_testc.result) :
        WER%    N1      N2      avg
        CLEAN   0.7     0.7     0.7
        SNR20   0.9     1.1     1.0
        SNR15   1.4     1.5     1.4
        SNR10   2.3     2.9     2.6
        SNR5    5.7     8.1     6.9
        SNR0    17.7    21.9    19.8
        SNR-5   48.7    54.4    51.6
                        Mean ratio to HTK base = 41.2%
                             Avg. WER 20-0 SNR = 6.35%
One of the changes in Aurora-2000 is that the overall energy level roves much more widely than in 1999. For this reason, all the experiments I've done so far have used per-utterance normalization of the means and variances in each feature dimension. To do this, you need to 'know' the whole utterance before you process it, so it's not compliant with the finite processing delay requirement of the Aurora task. To avoid this problem, I implemented very simple online normalization within our training scheme, where the mean and variance are recursively updated using a simple first-order decay i.e.
and
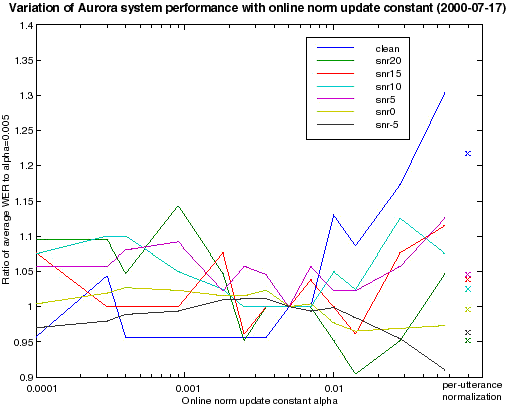
where mean and var are the values from the last time step, and mean' and var' are the new estimates for the current time step. I didn't know what values of alpha_m and alpha_v to use, so I conducted a range of experiments trying different values. Essentially they made very little difference - it appears as though not using online adaptation of means and variances (equivalent to very small alphas) is about as good as the best value, although alpha larger than about 0.005 (for an update time constant of 200 steps or 2 seconds) does degrade the recognition at high SNRs. The plot below shows the variation in system WER as a function of the update constant (alpha_m and alpha_v are the same), with the WER at each SNR normalized relative to the system at alpha=0.005. Also shown are the results for the per-utterance normalization we had been using so far; it seems that relatively slow online normalization is significant better in clean, at least.
Here are the full results for the alpha=0.005 system:
        a2-testa - plp12ddO050-ta2multi-i0 :
        WER%    N1      N2      N3      N4      avg
        CLEAN     1.8     2.6     2.3     2.4   2.3
        SNR20     1.8     2.3     1.9     2.4   2.1
        SNR15     2.3     3.0     2.2     3.1   2.6
        SNR10     3.0     4.3     3.5     5.0   4
        SNR5      6.8    10.8     6.6    10.5   8.7
        SNR0     20.3    37.5    22.1    24.3   26
        SNR-5    52.3    76.4    68.5    55.1   63.1
                        Mean ratio to HTK base = 88.5%
                             Avg. WER 20-0 SNR = 8.69%
These should be compared to per-utterance normalization plp12ddN (HTK Mean Ratio of 93.4% / Avg WER 20-0 = 8.75%) and global normalization only, plp12dd (HTK Mean Ratio 90.3% / Avg WER 20-0 = 8.91%). So it's a little better. (It's surprising, however, that the global-normalized-only plp12dd does as well as it does; here are the full values for it:
        a2-testa - plp12dd-ta2multi-i0 :
        WER%    N1      N2      N3      N4      avg
        CLEAN     2.1     2.5     2.1     2.3   2.2
        SNR20     2.2     2.5     2.0     2.4   2.3
        SNR15     2.1     3.2     2.2     3.2   2.7
        SNR10     3.0     4.7     3.9     5.2   4.2
        SNR5      6.7    11.6     6.8    11.2   9.1
        SNR0     20.0    35.0    23.6    26.8   26.4
        SNR-5    49.2    74.1    64.2    56.1   60.9
                        Mean ratio to HTK base = 90.3%
                             Avg. WER 20-0 SNR = 8.91%
It's hard for you to see, but comparing these to the plp12ddN figures, it's doing better on CLEAN and SNR20. This is consistent with what I've seen in the past - that per-utterance normalization actually hurts in clean. But it's surprising that omitting any kind of adaptive normalization doesn't hurt more, especially since Aurora-2000 is supposed to include more energy roving.)
Back to ICSI AURORA homepage - ICSI RESPITE homepage - ICSI Realization group homepage