1997may27 Dan Ellis <dpwe@icsi.berkeley.edu>
Florian asked Morgan for a reference to support the well-known assertion that the cepstral transform 'decorrelated' spectral-style coefficients. This led to an interesting discussion, and Florian's measurements showed that cepstral coefficients had quite large correlation coeffients between one another. I had been playing around with average feature statistics and both spectral and cepstral features, so Morgan asked me to get some comparison measures for correlations between features in the two domains. These are my results.
A feature vector is a particular data point with values in a number of dimensions. If one dimension is highly predictable from the values in some of the other dimensions, it is contributing rather little information to the overall vector, and one or more dimensions should probably be eliminated to simplify the classification problem. As a special case, if two dimensions are highly correlated (i.e. one is linearly dependent on the other), then they are contributing less information than they could in the ideal. Thus, in classification, we would like our feature dimensions to take on values that are uncorrelated with each other, in the hope that they are independent of one another.
At the very least, rotating a feature space so that the major axes of variation are aligned with feature dimensions means that the distributions can be modeled with simplified multidimensional Gaussian distributions whose off-diagonal covariance values are zero. This has great advantages in terms of computational complexity and training time, so the cepstral transform (primarily a rotation of feature space) is used in speech processing because it is believed to decorrelate spectral features i.e. drive their off-diagonal correlation coefficients to zero. (The cepstral transform has other advantages too: truncating it amounts to 'smoothing' along the spectral axis, which is desirable, and the separation of the average level (coefficient 0) from the spectral shape (remaining coefficients) is a particularly important normalization).
To get a feeling for how much the cepstral transform really does decorrelate speech spectral features, I calculated the normalized cross-correlations for a chunk of speech represented by spectral and cepstral features.
I was working with the TIMIT dataset. For these results, I used the first 100 utterances of the standard randomized training set (the "ntimit-trainrand.list", even though I was using TIMIT, not NTIMT). This corresponded to 25,335 frames at the 12.5 ms frame rate I used.
Cepstral coefficients were obtained with log-rasta-plp using a 12th-order model. The window length was 25 ms (400 samples at 16 kHz).
Spectral coefficients were taken as the linear output of the rasta band-pass filters i.e. between the exponentiation and the spectral weighting in the conventional rasta chain (before cube-root compression). I implemented a new rasta option, -Q, to save the data at this stage of processing.
Results were calculated by accumulating the mean and variance of each feature dimension, and the mean of the outer product of the feature vectors. Normalized cross-correlation was then calculated as E((x-ux)(y-ux)/sqrt(var(x)var(y)) == (E(x.y) - ux.uy)/sqrt(var(x).var(y)). As well as calculating this for the entire data set, the averages were formed for each phoneme class, according to the hand-labellings. However, these results were not analyzed (Florian reported that the per-label correlations were a little bit larger, on average, than those of the grand average).
For reference, here is how I produced the numbers:
        > cd ~dpwe/projects/TIMIT/rasta/H-sun4-sunos5/
        > ./rastapf -i ../../expt1/trainrand.list -o timit-train-100-lcb.pf -L -w 25 -s 12.5 -S 16000 -m 12 -t 100 -Q
        > ./feaxcorr -f timit-train-100-lcb.pf -l ../../expt1/timit-trainrand-labels+icsi56.pfile -o timit-t100-lcb-xco.pf
        > ./fmtpfile.tcl timit-t100-lcb-xco.pf > lcb.xco
"rastapf" is my hacked version of rasta that reads soundfiles using dpwelib and writes pfiles usiing the quicknet library. The -Q option writes the linear spectral outputs, and -t specifies a maximum number of utterances to process. The trainrand.list file contains complete paths to TIMIT waveform files. "feaxcorr" accumulates and calculates the correlations, taking the phoneme class labels from a standard corresponding label pfile. "fmtpfile.tcl" is a tcl script to print a chunk of a pfile to the terminal, which uses my Tcl wrappers around the quicknet pfile lib to allow direct access to pfile information from within Tcl.
Since the normalized correlations are constrained to lie between -1 and 1, I have displayed them as 2-digit percentages. 1.00 was clipped to 99.
Normalized correlations for cepstral coefficients (13 x 13):
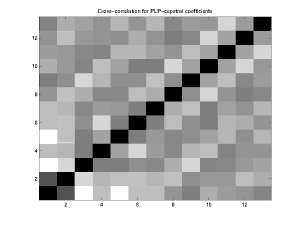
  99  36 -62 -21 -64 -23 -22  03  16 -09 -01  03  14
  36  99 -50 -14 -30 -27 -18 -25  07  01  01 -21 -10
 -62 -50  99  29  28  09  10 -13 -32  14  11  00 -07
 -21 -14  29  99 -06 -43 -02  11 -18 -23  13  03  03
 -64 -30  28 -06  99  17  00  10  06 -04 -16  06 -16
 -23 -27  09 -43  17  99  19 -20  06  18 -14 -12  03
 -22 -18  10 -02  00  19  99 -11 -25  20 -05  03 -18
  03 -25 -13  11  10 -20 -11  99  08 -32  03  15  11
  16  07 -32 -18  06  06 -25  08  99 -07 -22  10 -01
 -09  01  14 -23 -04  18  20 -32 -07  99 -04 -31  00
 -01  01  11  13 -16 -14 -05  03 -22 -04  99 -06 -32
  03 -21  00  03  06 -12  03  15  10 -31 -06  99 -02
  14 -10 -07  03 -16  03 -18  11 -01  00 -32 -02  99
Normalized correlations for linear auditory spectral coefficients (19 x 19):
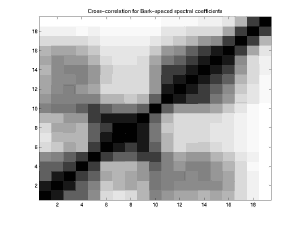
 99 83 64 59 44 16 13 15 26 47 43 36 34 31 34 29 14 06 02
 83 99 83 63 49 25 27 34 33 53 49 46 44 45 45 37 18 06 02
 64 83 99 76 61 34 31 35 39 53 49 50 46 47 43 36 19 06 02
 59 63 76 99 74 32 26 27 39 66 49 43 49 49 42 33 16 05 02
 44 49 61 74 99 80 65 59 70 74 48 35 40 42 33 25 12 06 02
 16 25 34 32 80 99 92 81 86 58 28 17 20 21 14 10 06 04 02
 13 27 31 26 65 92 99 93 90 55 26 14 16 17 13 09 06 04 01
 15 34 35 27 59 81 93 99 91 53 25 14 15 15 13 09 06 03 01
 26 33 39 39 70 86 90 91 99 65 29 15 18 18 16 10 06 03 01
 47 53 53 66 74 58 55 53 65 99 67 38 41 42 36 21 10 04 02
 43 49 49 49 48 28 26 25 29 67 99 85 79 70 52 40 18 12 04
 36 46 50 43 35 17 14 14 15 38 85 99 91 77 58 46 22 13 05
 34 44 46 49 40 20 16 15 18 41 79 91 99 92 71 59 29 15 05
 31 45 47 49 42 21 17 15 18 42 70 77 92 99 86 71 38 18 06
 34 45 43 42 33 14 13 13 16 36 52 58 71 86 99 85 45 17 06
 29 37 36 33 25 10 09 09 10 21 40 46 59 71 85 99 74 34 12
 14 18 19 16 12 06 06 06 06 10 18 22 29 38 45 74 99 71 29
 06 06 06 05 06 04 04 03 03 04 12 13 15 18 17 34 71 99 73
 02 02 02 02 02 02 01 01 01 02 04 05 05 06 06 12 29 73 99
Rasta actually produces 21 bands for this 16 kHz sampled data, but the first and last bands are deemed invalid and clamped to zero.
You can extract these results yourself like this:
	> cd ~dpwe/projects/TIMIT/rasta/H-sun4-sunos5
	> ./fmtpfile.tcl dataset=n timit-t100-r12-xco.pf
Where the dataset is 0 for the grand averages, and 1..56 for each of the ICSI56 label classes. timit-t100-r12-xco.pf contains the correlations for the rasta-plp coefficients; for the linear spectral coefficients, it's timit-t100-lcb-xco.pf . Note that the data volumes for each label are sometimes quite small and vary from 16 frames of /em/ to 3374 frames of /h#/.